Ultranalysis® Suite 3

Organize your condition monitoring strategy with Ultranalysis® Suite 3
Ultranalysis provides powerful flexibility to manage any combination of assets; from a few hundred to several thousand. An asset database is your condition monitoring roadmap.
UAS3 is compatible with SDT270, SDT340 and LUBExpert providing the flexibility to manage any combination of assets and tasks. Furthermore, you can manage data in your own language, UAS3 features seven languages including English, French, Dutch, German, Italian, Spanish, and Russian.
Organizing your condition monitoring program has never been easier with UAS3.
 An asset database is your condition monitoring roadmap. Our seven-level, tree structured hierarchy, gives data collection personnel exact directions to navigate to every measurement point. Multiple data folders give unprecedented organization to even the most complex factory layout. In fact, organizing your condition monitoring program has never been easier with UAS3.
FocUS Mode is a game changing feature. Increased sampling rate and better sensitivity lend confidence and accuracy to diagnosis. Even though mechanical anomalies are really good at hiding, FocUS Mode connects inspectors with the tools to reveal those hard to decipher defects.
An international standardized unit of measurement for ultrasound has the potential to connect every ultrasound inspector in the world, regardless of the equipment they use. SDT340 can lead this revolution.
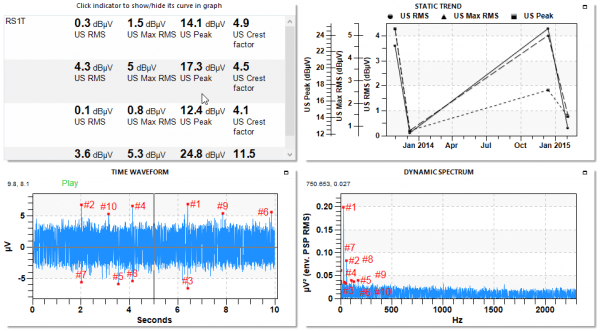
Dashboards bring essential information into focus. UAS3 uses powerful widgets that report, in a single view, operational changes. Widgets include:
The Static Trend
Build your trend directly from the measurement matrix by clicking on the condition indicators you want to see. Overlay Acceleration, Velocity, Ultrasound overall and max RMS, Peak, Crest Factor, RPM and Temperature for direct defect correlations and comparisons.
The Time Waveform
UAS3 adds powerful levels of control and functionality. A new timeline bar drills down to the millisecond of any measurement sample. Then, use the Sample Disposal icon to remove unwanted portions of the signal. Once deleted, UAS3 does a smart recalculation of the condition indicators. No other software allows you the flexibility to remove bad data and recalculate in the comfort of your office chair.
A new playback cursor travels in step with the signal allowing analysts to follow every click, pop, crackle, squeak, and rub. UAS3 automatically labels the 10 highest impact points of the signal.
The Spectrum
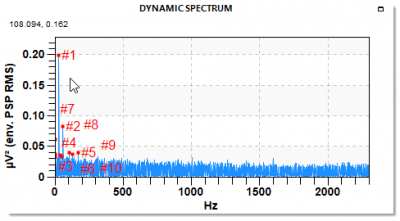
The 3rd generation of UAS features a new and innovative algorithm for ultrasound signal processing. We can say, with full confidence, there is nothing else like this in the market. The Ultrasound Envelope Power Spectrum (UEPS) displays the source defect frequencies. UEPS displays the primary and harmonic frequencies of any machinery defect.
What this means for ultrasound analysts:
- root failure cause and failure evolution effects beautifully present themselves in the FFT view. Fault patterns leap of the computer screen and copy/paste easily into asset report documents.
- UEPS is the perfect tool for diagnosing defects in rotating machines, bearings, gear mesh, reciprocating valves, partial discharge, steam traps, valves, and more
UAS3’s spectrum diagnostic capabilities make it the best platform integrating ultrasound and vibration predictive analysis. Want a global view of your asset health? Look no further than UAS3.
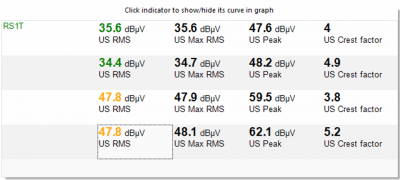 The Measurement Matrix is a critical element of the UAS3 Dashboard. Use the Matrix to see a snapshot summary of measurement types per asset, or summary of the last four recorded measurements by type.
With your SDT270, SDT340 or LUBExpert the matrix measurement list can include:
- Static Ultrasound – RMS, Max RMS, Peak, Crest Factor
- Dynamic Ultrasound
- Vibration – Acceleration, Velocity
- Temperature – C/F
- RPM
Both Matrix summaries emulate the Green/Yellow/Red alarm codes to immediately direct your attention to the assets that need the fastest attention. In other words, the UAS3 Measurement Matrix simplifies and accelerates the user interface experience.
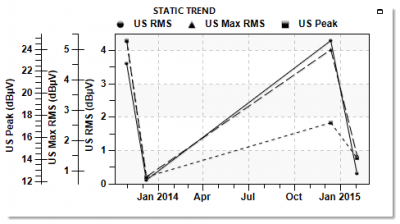
Static Trend
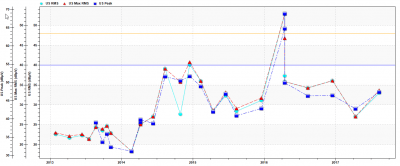
UAS3 delivers a new level of analytical power for ultrasound professionals. Data on the trend graph is populated directly from the Measurement Matrix for a truly exceptional point and click experience. Overlay any static data resident in the same tree structure for direct asset comparisons.
Choose from three graph sizes:
- Widget Scale (Quarter pane)
- Normal Scale (Full pane)
- Max Scale (Full screen)
First, select your plotting method from a choice of single curve as Point, Line, Bar, Area, Stick and Ribbon. Then, put your own unique touch on reports and views with customizable foreground, background, marker, line type and color. Finally, export graphs as image files, WMF or text file for free, unrestricted report generation directly in your own template.
The Static Trend functions in UAS3, with multiple export formats and a variety of plotting methods, delivers conveniences while revolutionizing the user’s experience.
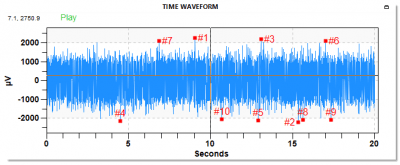
Dynamic Time Waveform
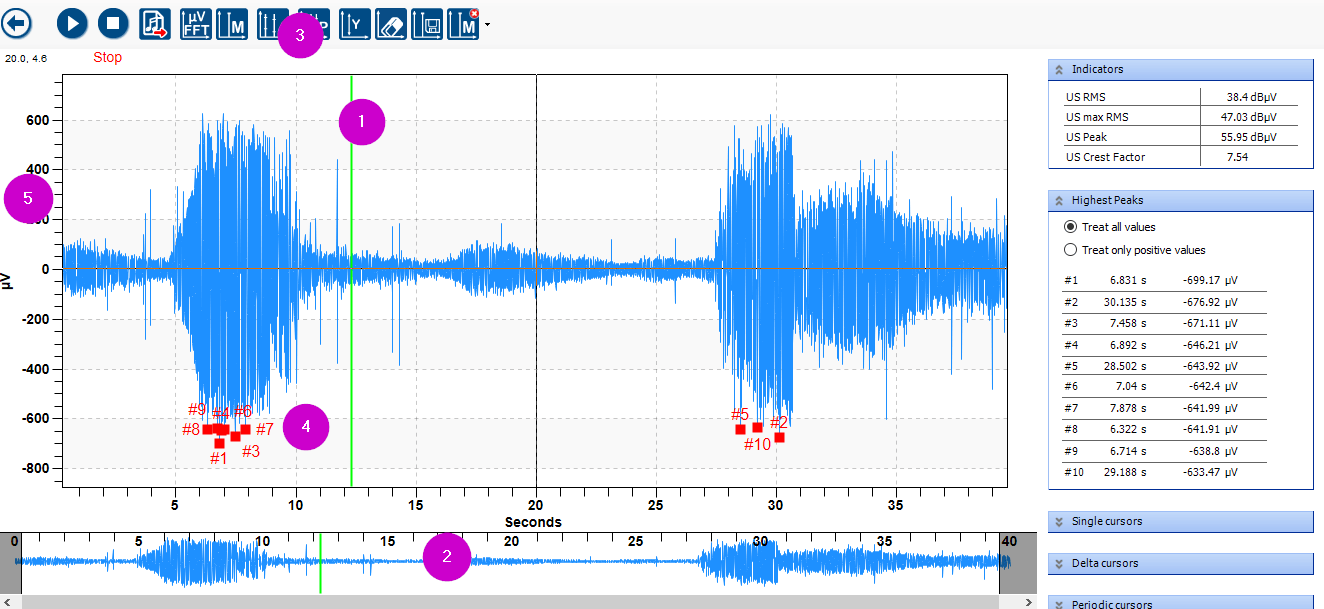
- Scrolling Playback Cursor: A scrolling playback cursor visually directs you through the time signal during playback. Now you can follow along to every defect as UAS3 traces each ultrasonic crackle, click and rub.
- Timeline Bar: The SDT270, SDT340 and LUBExpert provides user-adjustable data acquisition time for all measurements. The addition of a new timeline bar facilitates fast navigation and easy zooming through these long measurements.
- Smart Cursors: UAS always featured useful Single, Delta, and Periodic Cursors. In UAS3, the ability to customize and save these cursors makes analysis faster, and the experience more enjoyable.
- Impact Markers: Each Dynamic Time Graph automatically displays and labels the 10 highest values sampled. Users can choose to display only the highest POSITIVE values, or the highest POSITIVE and NEGATIVE values.
- Y-Axis Rescaling: Like UAS2, UAS3 gives full control to the ultrasound analyst for comparing two or more machine signals. Controlled Y-Axis rescaling only makes sense, and UAS3 is the only ultrasound software that features this necessary analytical tool.
Removal of Unwanted Data: UAS3 adds the power to remove unwanted portions of a time signal. Imagine collecting a 10 second signal and removing the first and last 2 seconds because the machine stopped and started during the measurement. Using the Timeline Bar, zoom in and cut the unwanted portion of the signal. UAS3 automatically saves the new signal, and recalculates the overall and max RMS, Peak, and Crest Factor. How smart is that?
Mouse Wheel Zoom Function: With 8,000 to 256,000 measurements (FocUS mode) per second captured by the SDT270, SDT340 or LUBExpert there’s a lot to see. An intelligent mouse wheel function zooms in to the nanosecond of any time signal.
Overlay any static data resident in the same tree structure for direct asset comparisons. Choose from three graph sizes:
- Widget Scale (Quarter pane)
- Normal Scale (Full pane)
- Max Scale (Full screen)
Use additional controls added for:
- Cross cursor, data markers, and data labels
- Customizable line color and weight
- Export as image, WMF, or text file
UAS3 Time Waveform is more than just the “sound” of your machine. This view is a traceable, comparable, and calibrated representation of Ultrasound and Vibration measurements, captured with the world’s most accurate, portable ultrasound measurement instrument.
Dynamic Spectrum
UAS3’s Ultrasound Envelope Power Spectrum is a game changing advancement for analysis of ultrasound and vibration spectrums in a single application. Plot both vibration velocity and acceleration, or ultrasound envelope power spectrum data from the same asset measurement. Or overlay older measurement data with the last measurement from any other measurement location.
Use the intelligent mouse wheel zoom feature to drill deep into your data and then quickly back again. Or navigate through the signal or modify the zoom using the all new Frequency Bar.
Recall saved Single, Delta and Periodic Cursors for advanced analytics. Apply markers to graphs labelling the 10 highest peak values and sort them from lowest to highest, or highest to lowest values.
Rescale Y-Axis values for more comparative analytics.
Choose from 3 graph pane sizes:
- Widget Scale (Quarter pane)
- Normal Scale (Full pane)
- Max Scale (Full screen)
Use additional controls added for:
- Cross cursor, data markers, and data labels
- Customizable line color and weight
- Export as image, WMF, or text file
The unprecedented analytical power of UAS3 is demonstrated with the proprietary Ultrasound Envelope Power Spectrum algorithm. There is no better platform available that integrates, with such accuracy, both ultrasound and vibration asset condition data.
Ultrasound inspectors spend much of their working hours gathering and analyzing asset health data, and they need an easy way to communicate their findings to every stakeholder. Therefore, SDT embedded flexible yet powerful reporting tools inside UAS3 that help inspectors craft meaningful stories to describe the condition of an asset, what is required to fix it, and the potential cost impact if it is left to fail.
UAS3 allows analysts to select only the data needed to tell their story, warn about the impact, and stimulate the team into action.
UAS3 includes a functionality that will help you diagnose bearing faults by identifying which ones have defects, where and what kind of defects they are.
Faults in any of the four bearing components generate specific frequencies based on the bearing geometry and rotating speed.
These four fault frequencies are commonly termed:
- BPFO – Ball Pass Frequency, Outer Race;
- BPFI – Ball Pass Frequency, Inner Race;
- BSF – Ball Spin Frequency;
- FTF – Fundamental Train Frequency.
With this feature on UAS3, simply select the bearing from the database, then enter the machine running speed to identify whether or not your acquired signal (vibration, ultrasound) matches with one of these predefined characteristics mentioned above.
Watch this informative video to get a better perspective!
Having to search through the manuals of thousands of bearing manufacturers to find out the technical specifications of a particular bearing in a particular machine is a thing of the past. Now you can simply scroll through our bearing database (more than 50K references included!) and save a lot of time. If it’s not there, just create it for future references!
The Bearing Toolbox of UAS3 is a game-changing feature that will revolutionize the way we approach condition monitoring. Everyone involved in asset maintenance should consider adding this to their toolbox. It will make life easier in a way it never has before. Make it your own.
 |
 |
 |
 |
| SDT340 Brochure | SDT340 Manual | SDT340 Pictures | SDT340 Softwares |
On-board measurements
Ultrasound, Vibration, Infrared temperature and Tachometer.
Dual Sensor Inputs
One for ultrasound measurement and one for vibration.
Time signal and spectrum
On-screen time waveform and FFT. Panning and zooming for signal navigation. Display of the 10 highest values.
Frequency range
20 kHz to 50 kHz (ultrasound). 10 Hz to 10 kHz (vibration)
Sampling rate
32, 64, 128 and 256 kHz oversampling FocUS Mode
Signal length per recording
600 seconds (32 kHz sample rate) or 150 seconds (128 kHz focUS Mode )
Data memory
4.2 GB allowing the storage of 71 minutes of signal sampled at 128 kHz or 286 minutes at 32 kHz
Sensitivity
Class I instrument exceeding ASTM 1002-11 requirements for gas leak detection using the appropriate sensor.
Display
Full color TFT 3.5” screen 320×480. Active area: width 48.96 mm (1.93”) x height 73.44 mm (2.89”)
Bluetooth
For audio streaming
Housing
Extruded aluminum, shock proof rubber protections
Dimensions
L x W x H 221 x 93.5 x 44 mm (8.7 x 3.7 x 1.7 inches)
Weight
720 g (25.4 oz), including battery
Headphone
Wired headset and wireless Bluetooth headset. The SDT340 is compliant to noise exposure health and safety requirements when using SDT provided models